
Why New Relic Is Essential for Every Magento 2 Project
Overview
New Relic is an Application Performance Monitoring (APM) platform that is essential for any Magento 2 project. Even if you have a small store, it makes tremendous sense to set up New Relic — diagnosing problems becomes much easier.
The platform offers a free tier with 100GB per month, and even if that's not enough for your needs (many stores stay within this limit), it's often sufficient to analyze why your store is running slowly, track increased traffic, and more.
How We Use New Relic with Magento 2
Performance Problem Diagnostics
First stop when issues arise — when a client complains about slow site performance, New Relic is the first place we check. It shows traffic spikes and any performance changes in real time:
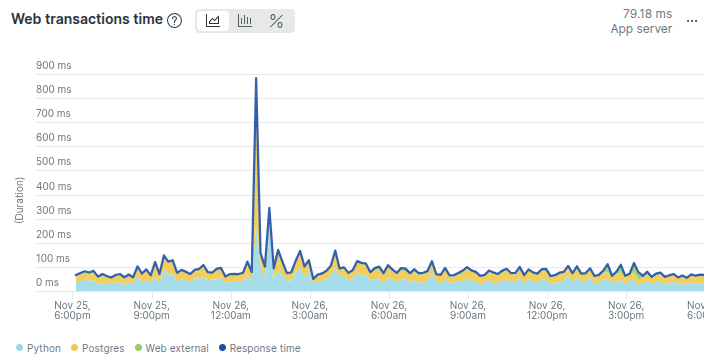
Transaction traces analysis — we use these to find bottlenecks. Very often we discover URLs that take 5-10+ seconds to load. Store owners may not even realize they're losing customers because of this:

Slow SQL queries and problematic code — helps identify bottlenecks that actually create significant infrastructure load.
Magento 2 Specific Monitoring
- Cron and queue problems — with the Magento 2 New Relic module enabled and configured, we can find and analyze issues in cron jobs and message queues
- Infrastructure issues — for example, detecting excessive MySQL usage
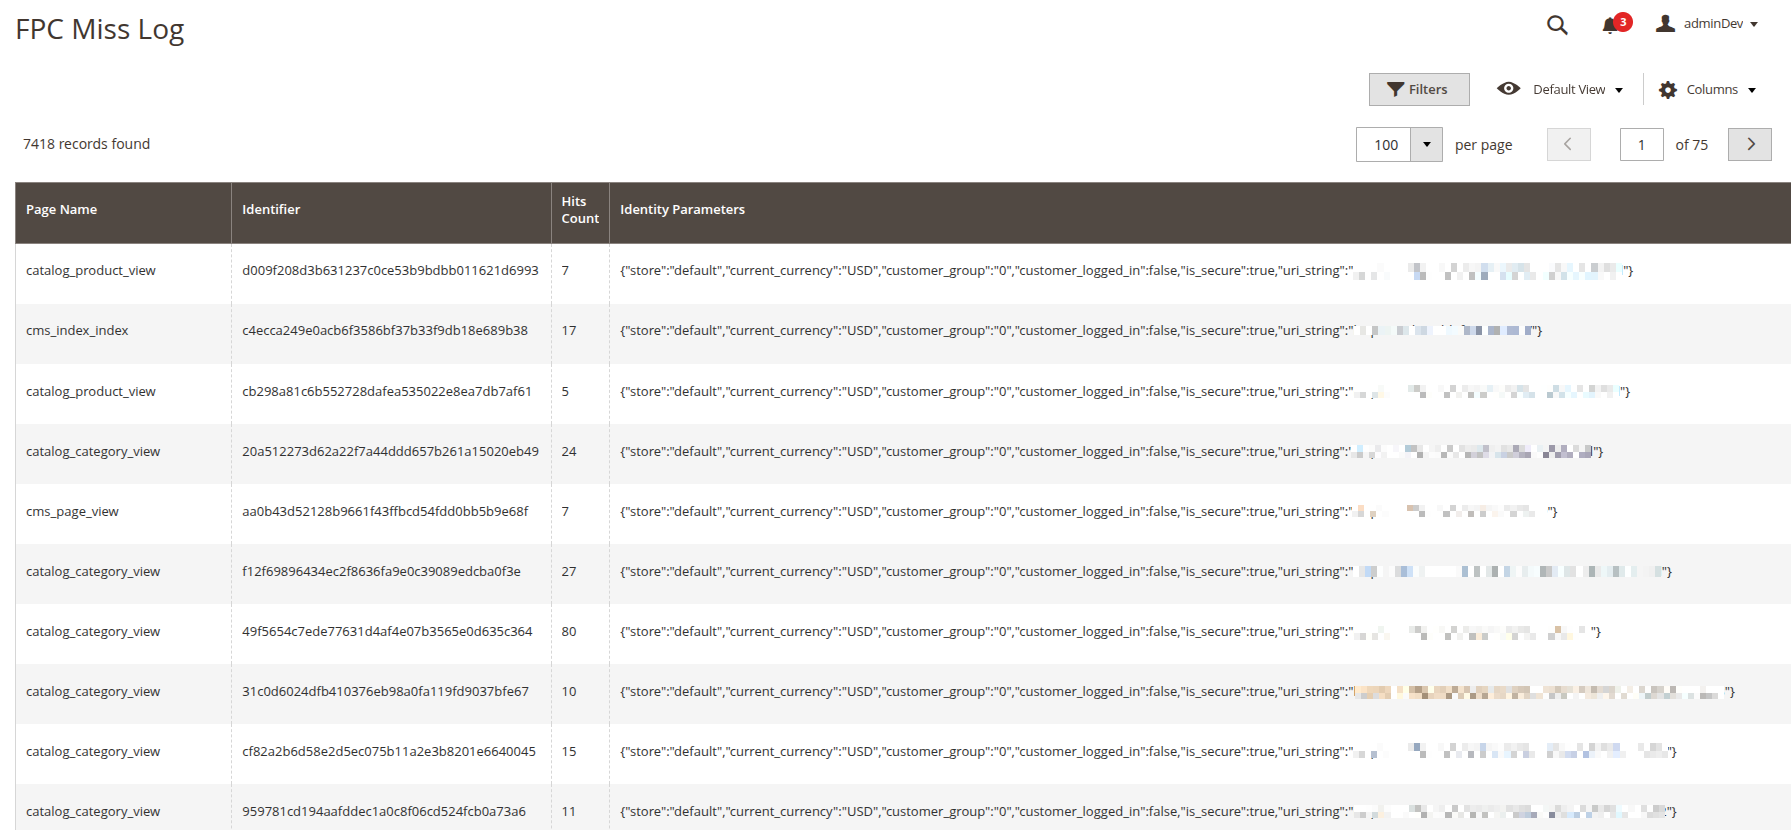
- Full Page Cache metrics — we set up metrics for FPC clearing and FPC MISSes. This lets us know if Full Page Cache is working poorly. And Magento 2 without Full Page Cache is an extremely slow system
Traffic and Bot Analysis
We often find transactions that the store doesn't even need. For example, bots frequently use GraphQL URLs to query the store, creating load — while GraphQL isn't even used by the store itself.
Frontend Performance
Google Page Speed (CWV) analytics — allows measuring LCP metrics on the fly, with traces. This is crucial for frontend optimization.
Recommendation: Disable New Relic Browser
Reasons to disable New Relic Browser:
- New Relic Browser embeds JavaScript code directly into the DOM of every page
- This increases HTML document size and affects Time to First Byte (TTFB)
- Frontend analytics are only needed when actively working on Core Web Vitals (CWV)
- Backend monitoring is sufficient for tracking store performance most of the time
Key New Relic Features for Magento 2
| Feature | What It Does | Value for Magento 2 |
|---|---|---|
| APM (Application Performance Monitoring) | Tracks PHP response times, throughput, errors | Critical for Magento performance |
| Transaction Traces | Detailed breakdown of slow requests | Find slow URLs and bottlenecks |
| Database Monitoring | Slow query analysis, query counts | Essential for MySQL optimization |
| Infrastructure Monitoring | CPU, memory, disk, network metrics | Server health visibility |
| Custom Dashboards | Build FPC, cron, queue metrics | Magento-specific insights |
| Alerts | Notifications on threshold breaches | Proactive issue detection |
| Browser Monitoring | Frontend performance, CWV | Enable only when needed |
What Problems New Relic Helps Solve
| Problem | How New Relic Helps |
|---|---|
| "The site is slow" | See exactly which transactions/URLs are slow and why |
| Traffic spikes | Real-time throughput graphs show when traffic increased |
| Bot attacks | Identify unusual transaction patterns and bot traffic |
| Database bottlenecks | Find slow queries and high query counts |
| Cron issues | With Magento module: track cron job performance |
| Memory/CPU spikes | Infrastructure monitoring shows resource usage |
| FPC not working | Custom metrics for cache hit/miss rates |
| Poor Core Web Vitals | Browser monitoring with LCP traces (when enabled) |
Conclusion
New Relic is an indispensable tool for Magento 2 projects of any size. The ability to see real-time performance data, analyze slow transactions, identify problematic SQL queries, and track infrastructure health makes it invaluable for maintaining a fast, reliable store.
Even if you're just starting out with a small store, installing New Relic now means you'll have historical data and monitoring in place when you need it most — when something goes wrong.