
Freento FullPageCache Analyzer
In Magento 2, the Full Page Cache (FPC) mechanism is one of the key tools for ensuring high store performance. FPC allows caching of fully rendered pages and serving them to users without executing PHP code or SQL queries. For Magento 2 without a headless theme (based on Luma, Hyva), Full Page Cache operation is critical. However, FPC effectiveness directly depends on how often cache misses occur and how frequently the cache is invalidated.
When FPC works correctly, pages load in 50-100ms. With a cache miss, load time can increase to 1-3 seconds, which critically affects user experience and store conversion.
FPC Impact on Page Load Time
| Scenario | Load Time | UX Impact |
|---|---|---|
| FPC Hit | 50-100ms | ✓ Excellent experience |
| FPC Miss (simple page) | 500-1000ms | ⚠ Noticeable delay |
| FPC Miss (complex page) | 1-3s | ✗ Negative experience |
| Frequent invalidations | Consistently high | ✗ Critical |
Freento FullPage Cache Analyzer is a tool for monitoring and analyzing Full Page Cache operation in Magento 2. The module records every cache miss and every cache cleaning operation, saving detailed information for subsequent analysis. This allows identifying problematic pages that frequently miss the cache and determining sources of overly frequent cache invalidation.
Key Features
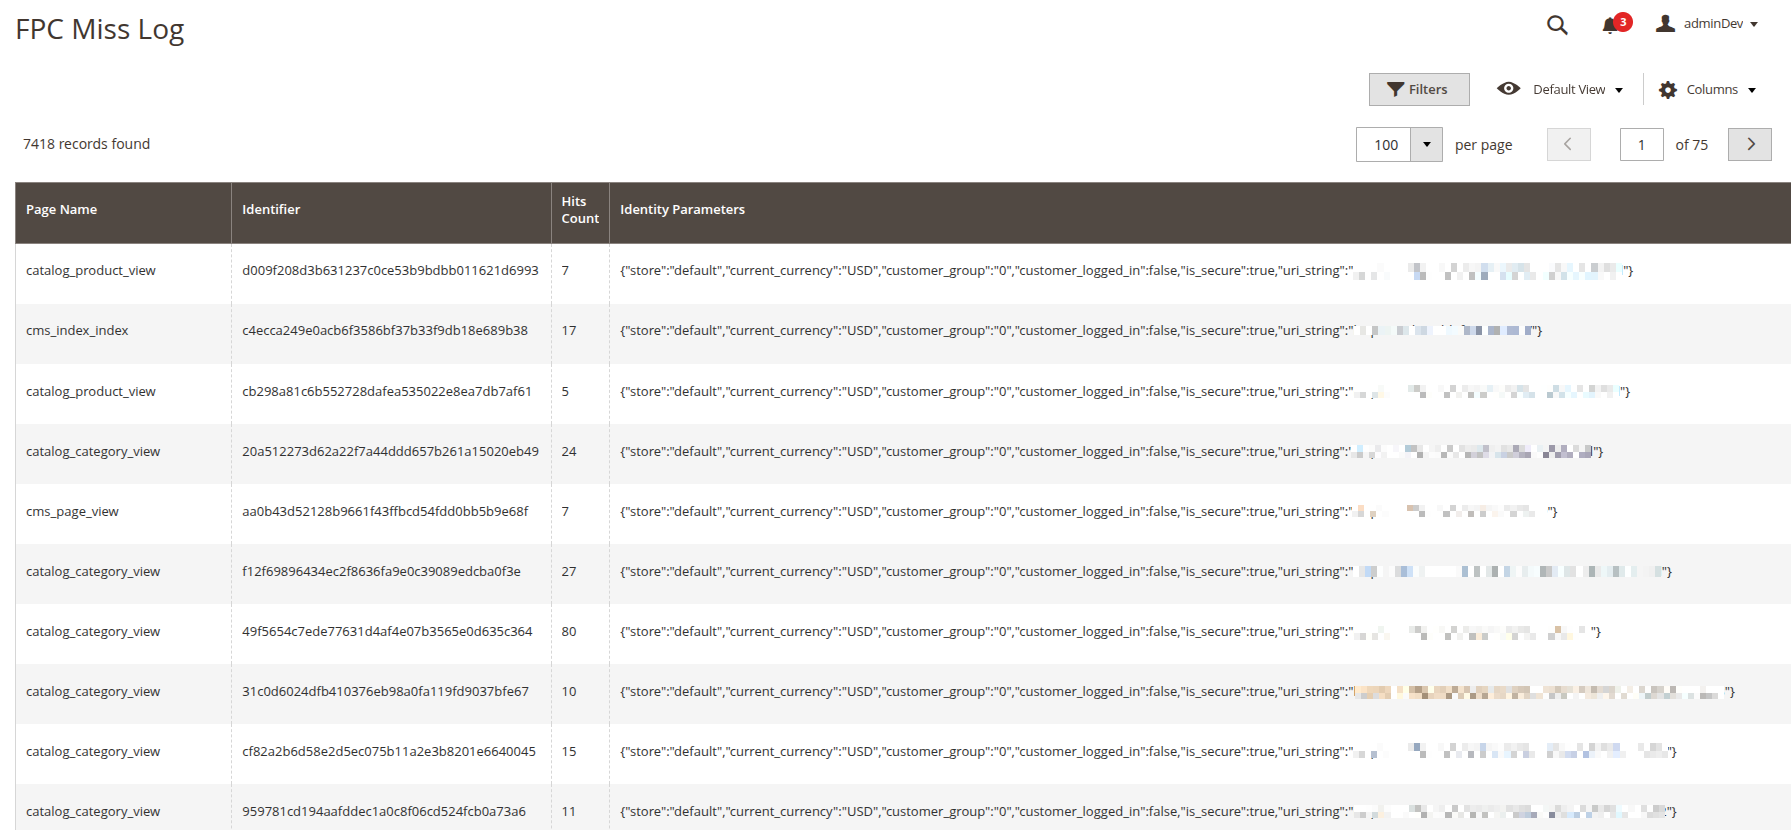
Cache Miss Logging (FPC Miss Log)
The module automatically tracks all cases when a page was not found in the cache. For each such event, information about the page, request parameters, and repetition frequency is saved. This allows understanding which pages most often load without cache and why.
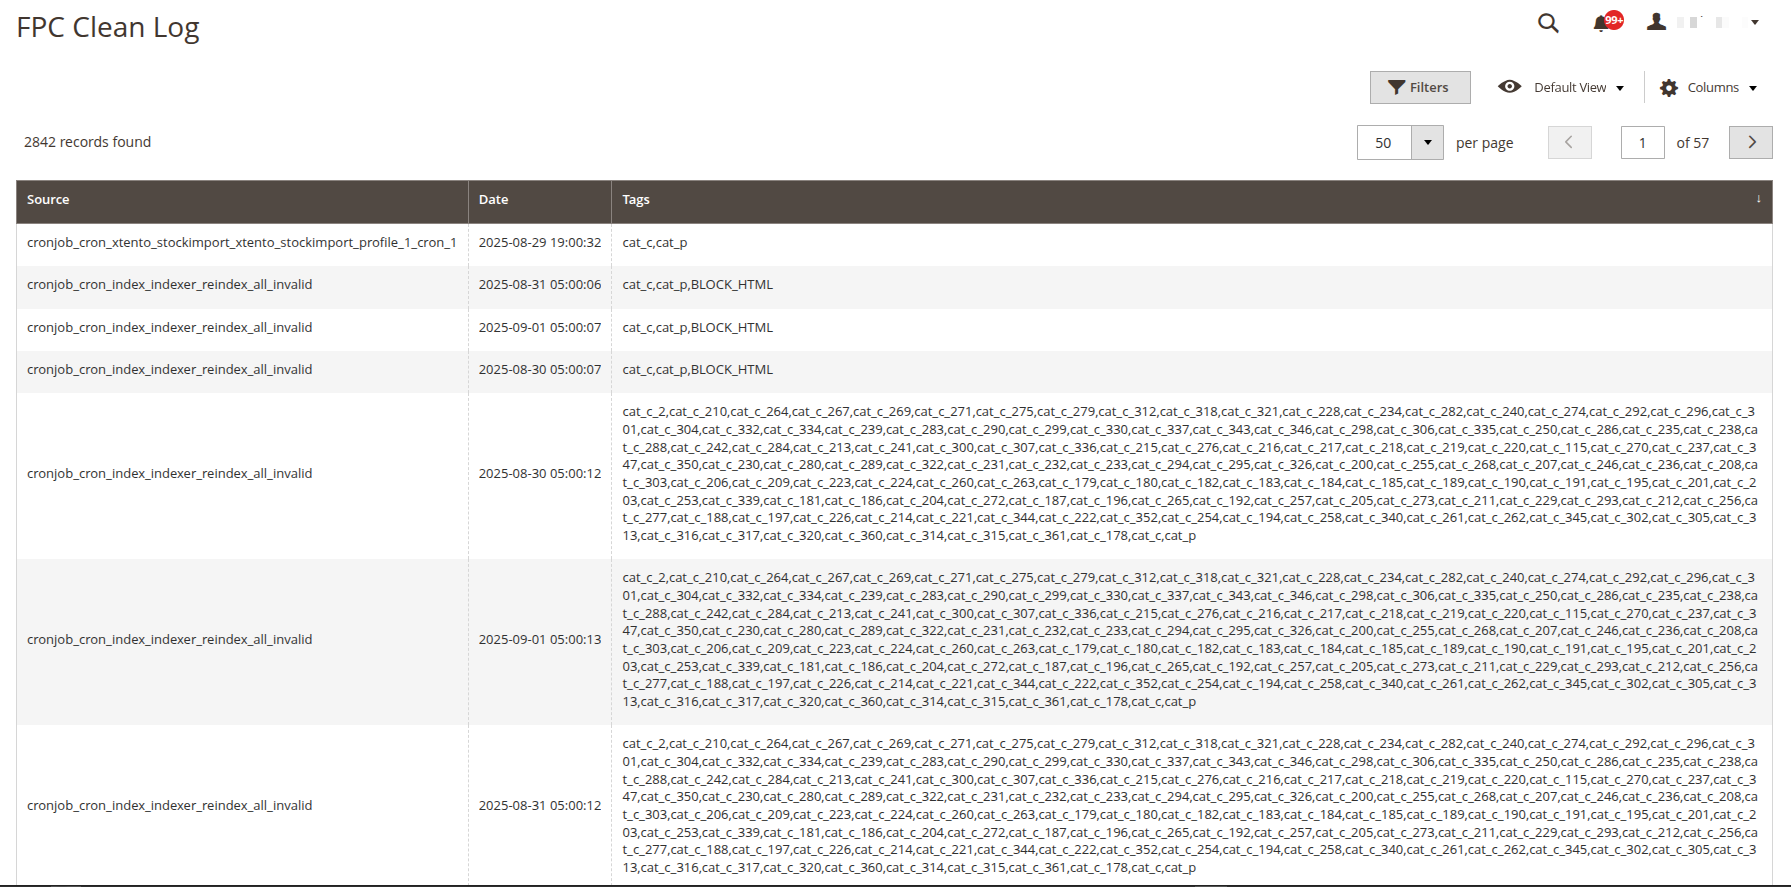
Cache Cleaning Logging (FPC Clean Log)
The module records all cache cleaning operations — both from the admin panel and via command line. For each operation, information about the cleaning source, time, and affected data is saved. This helps identify who or what is clearing the cache too frequently.
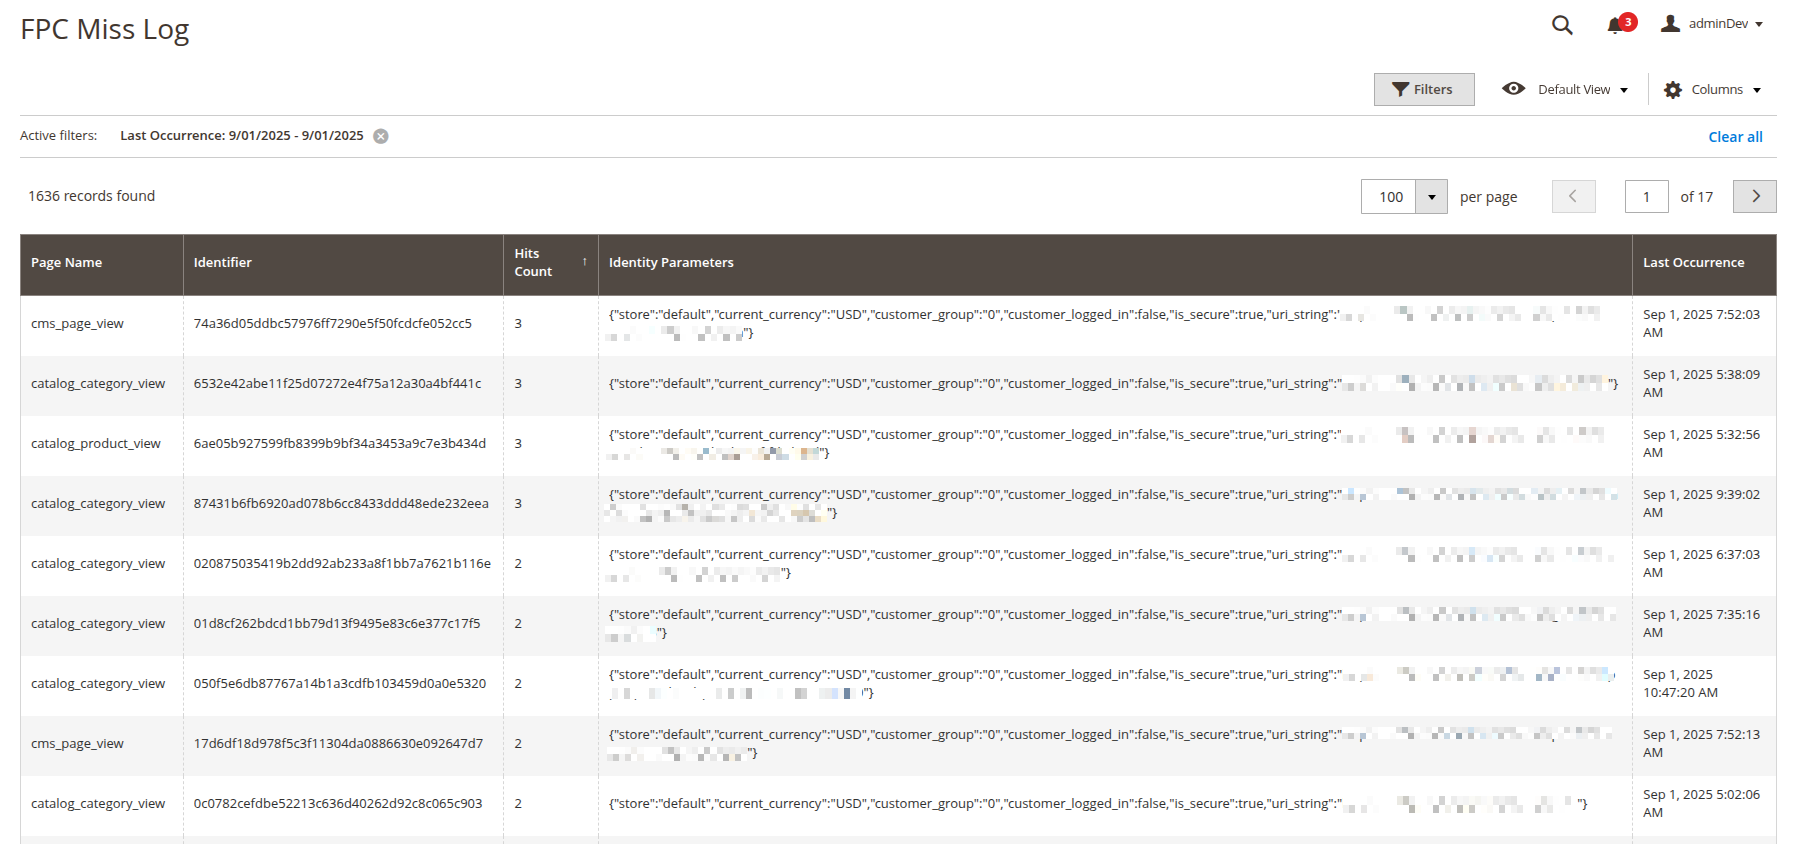
Administrative Interface
The module adds two grids in the menu Freento Performance Suite > FullPage Cache Analyzer:
- FPC Miss Log — aggregated cache miss statistics, grouped by page identifier
- FPC Clean Log — history of all cache cleaning operations with source and affected tags indication
Practical Application
Identifying Problematic Pages
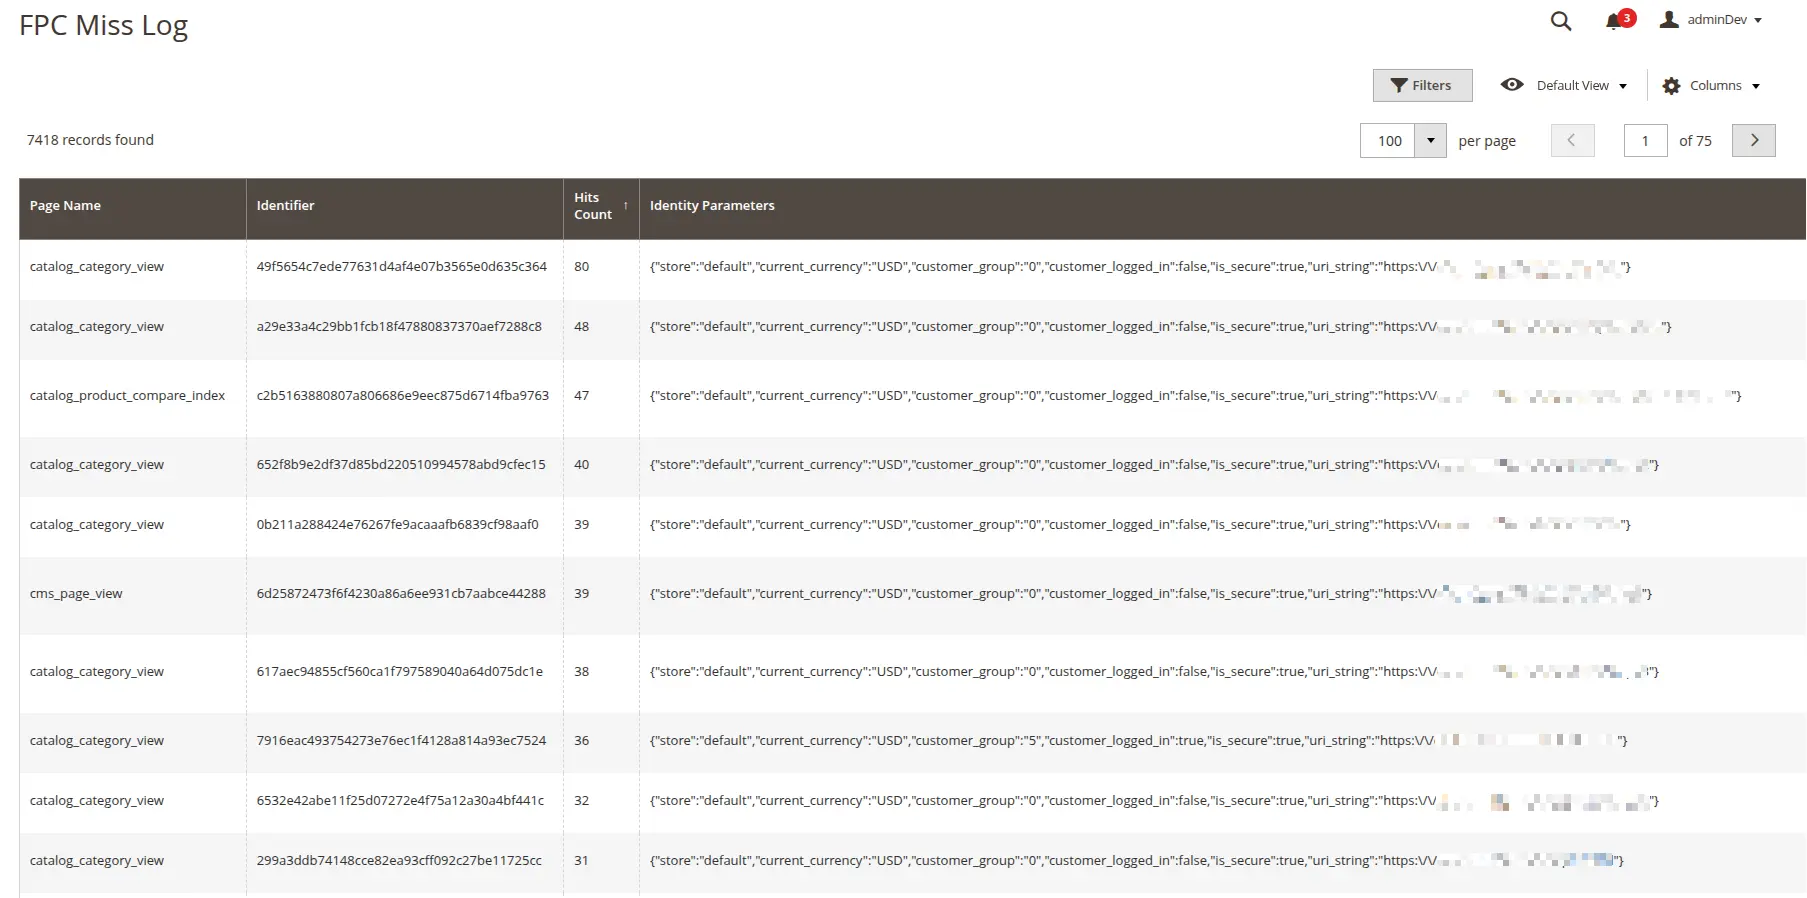
By sorting the FPC Miss Log grid by the "Hits Count" column, you can quickly identify pages with the highest number of cache misses. A high count may indicate:
- Dynamic content on the page — presence of blocks with
cacheable="false" - HTTP context issues — different Identity Parameters values for the same page
- Too frequent invalidation — the page is cached but quickly invalidated
Analyzing Frequent Invalidation
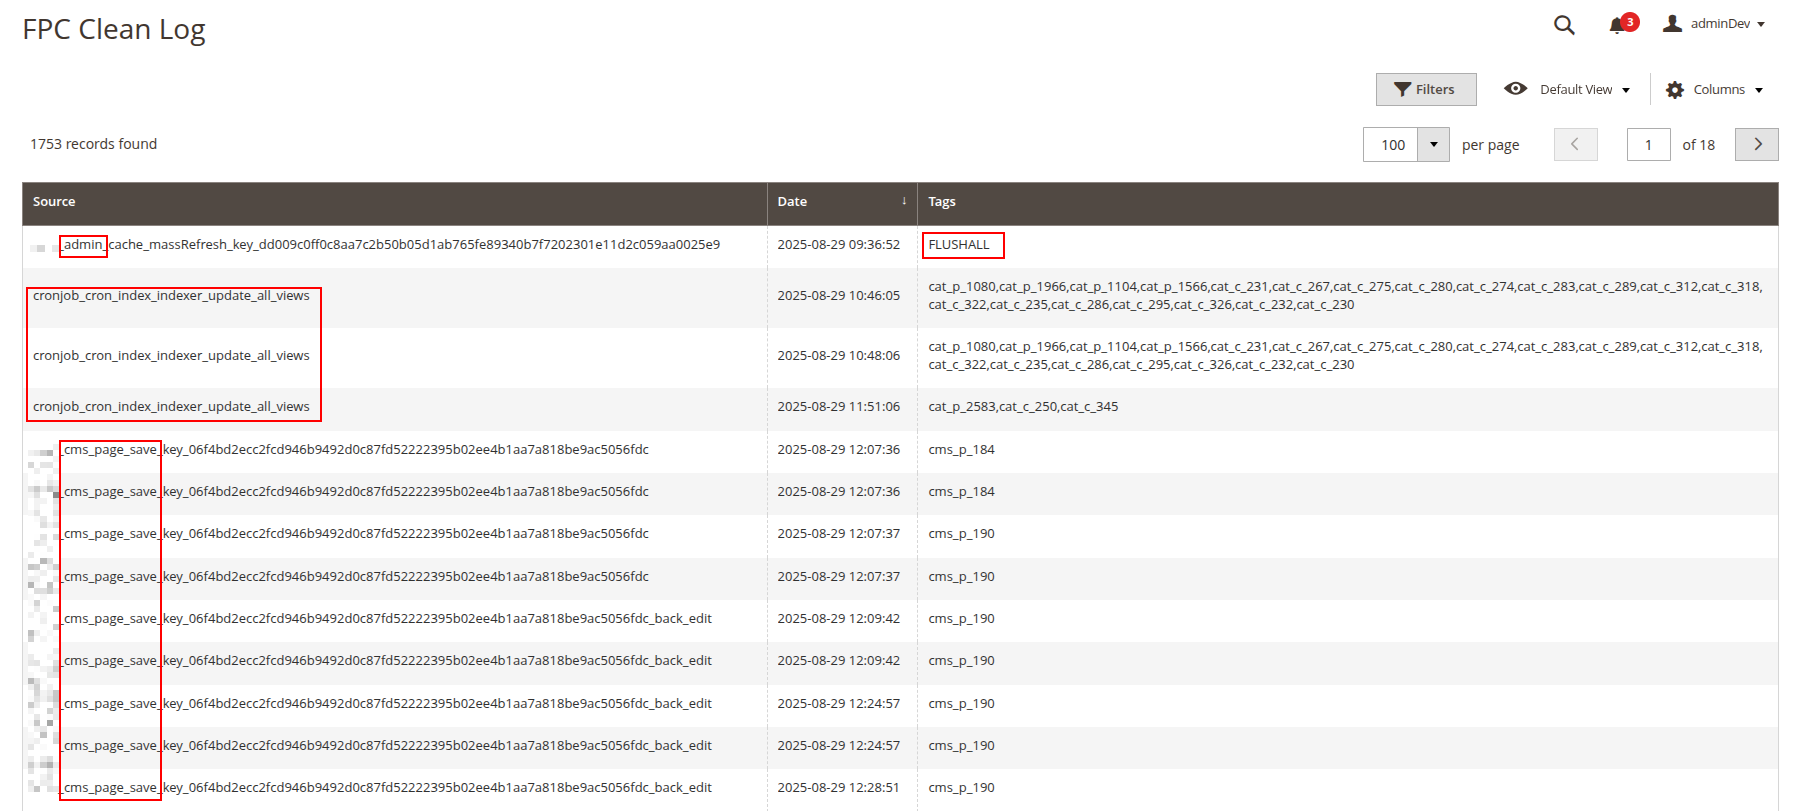
The FPC Clean Log grid allows identifying sources of excessive cache invalidation:
- Frequent cleanings from admin panel — indicates intensive content editing
- CLI commands — cron tasks or scripts cleaning the cache
- FLUSHALL operations — complete cache cleaning, which should be rare
Optimizing Identity Parameters
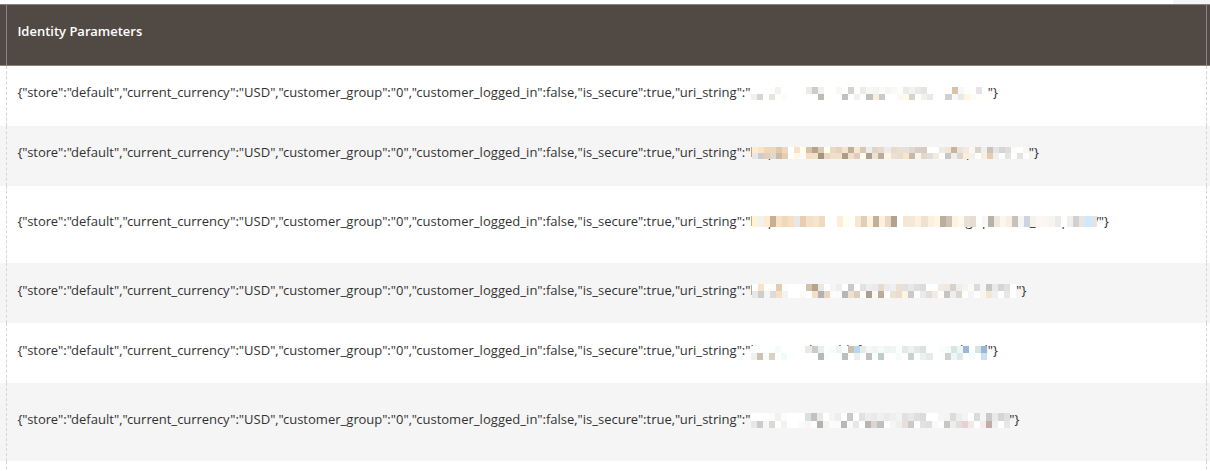
The Identity Parameters column in FPC Miss Log shows which HTTP context parameters affect the creation of separate cache versions. This helps identify:
- Excessive parameters added by custom modules
- Issues with customer groups configuration
- Incorrect handling of currencies or store views
Analyzing Cache Miss Dynamics
By analyzing FPC Miss Log data over a specific period, you can identify patterns in cache behavior:
- Cache reset frequency for specific pages (e.g., how often the home page loses cache)
- Days of the week with the most misses — this may indicate content manager activity or marketing campaign launches
- Time patterns — for example, miss spikes after certain cron tasks or during peak hours
- Correlation between admin operations and the increase in miss events
Why This Matters
Effective Full Page Cache monitoring is not just a technical metric, but a critically important factor for online store success.
Real-World Examples from Practice
In our practice, we regularly encounter cases where the store's home page is cleared more than 200 times per day. This means that most users see an uncached version of the page, which loads in 1-3 seconds instead of 50-100ms. The same applies to search bots — Google receives slow responses, which negatively affects the site's SEO positions.
Server Impact
Each pass through an uncached page requires:
- PHP code execution
- Multiple SQL queries to the database
- Rendering all page blocks
- Significant CPU and memory resources
With high traffic, this creates serious server load, which can lead to slowdown of the entire store or even its unavailability during peak hours.
User Experience and Conversion
Research shows that users are not willing to wait more than 3 seconds for a page to load. Each additional second of waiting reduces conversion by 7-10%. With working FPC, the server response becomes virtually instantaneous — the page loads in fractions of a second, creating a sense of a fast and responsive site.
Summary
Using Freento FullPage Cache Analyzer, you get:
- Transparency — a complete picture of how caching works in your store
- Control — the ability to quickly identify and fix caching issues
- Performance — consistently fast server responses for all users
- Resource savings — reduced server load and, consequently, infrastructure costs
- Conversion growth — satisfied users who don't leave due to slow loading