
Freento System Health
In Magento 2, many components must work together seamlessly: cron jobs, indexers, caching, database, Redis, Elasticsearch, and much more. When something fails, store owners often find out too late — when sales have already dropped or customer complaints have started pouring in.
The problem is compounded by the fact that Magento 2 does not provide a unified system health monitoring panel. Administrators have to manually check dozens of different parameters: indexer status, cron operation, log file sizes, cache state, and so on.
Freento System Health is a comprehensive Magento 2 health monitoring system that automatically tracks over 25 critical system parameters and instantly notifies administrators of problems via Email and Telegram.
Problems the Module Solves
Performance Issues
- Slow Cron Jobs — the module identifies jobs that take too long and affect overall system performance
- Disk Space Overflow — monitors log file and media folder sizes before they fill up the entire disk
- Database Growth — detects tables that have grown to critical sizes and require optimization
- Caching Problems — instantly reports disabled or invalidated cache
Reliability Issues
- Missed Cron Jobs — identifies situations when cron doesn't run on schedule
- Cron Job Errors — tracks jobs that completed with errors
- Stuck Indexers — finds indexers in "processing" or "invalid" status
- Elasticsearch Unavailability — instantly reports search engine problems
Security Issues
- Developer Mode on Production — verifies that the system is running in the correct mode
- "admin" Account — identifies dangerous accounts with default names
- Enabled XDebug — detects debugging tools on production server
- Password Reset Tools — monitors availability of potentially dangerous utilities
Configuration Issues
- Incorrect PHP Settings — checks memory limits and script execution time
- Redis Problems — identifies key eviction due to memory shortage
- Suboptimal MySQL Configuration — analyzes database optimizer settings
System Monitors
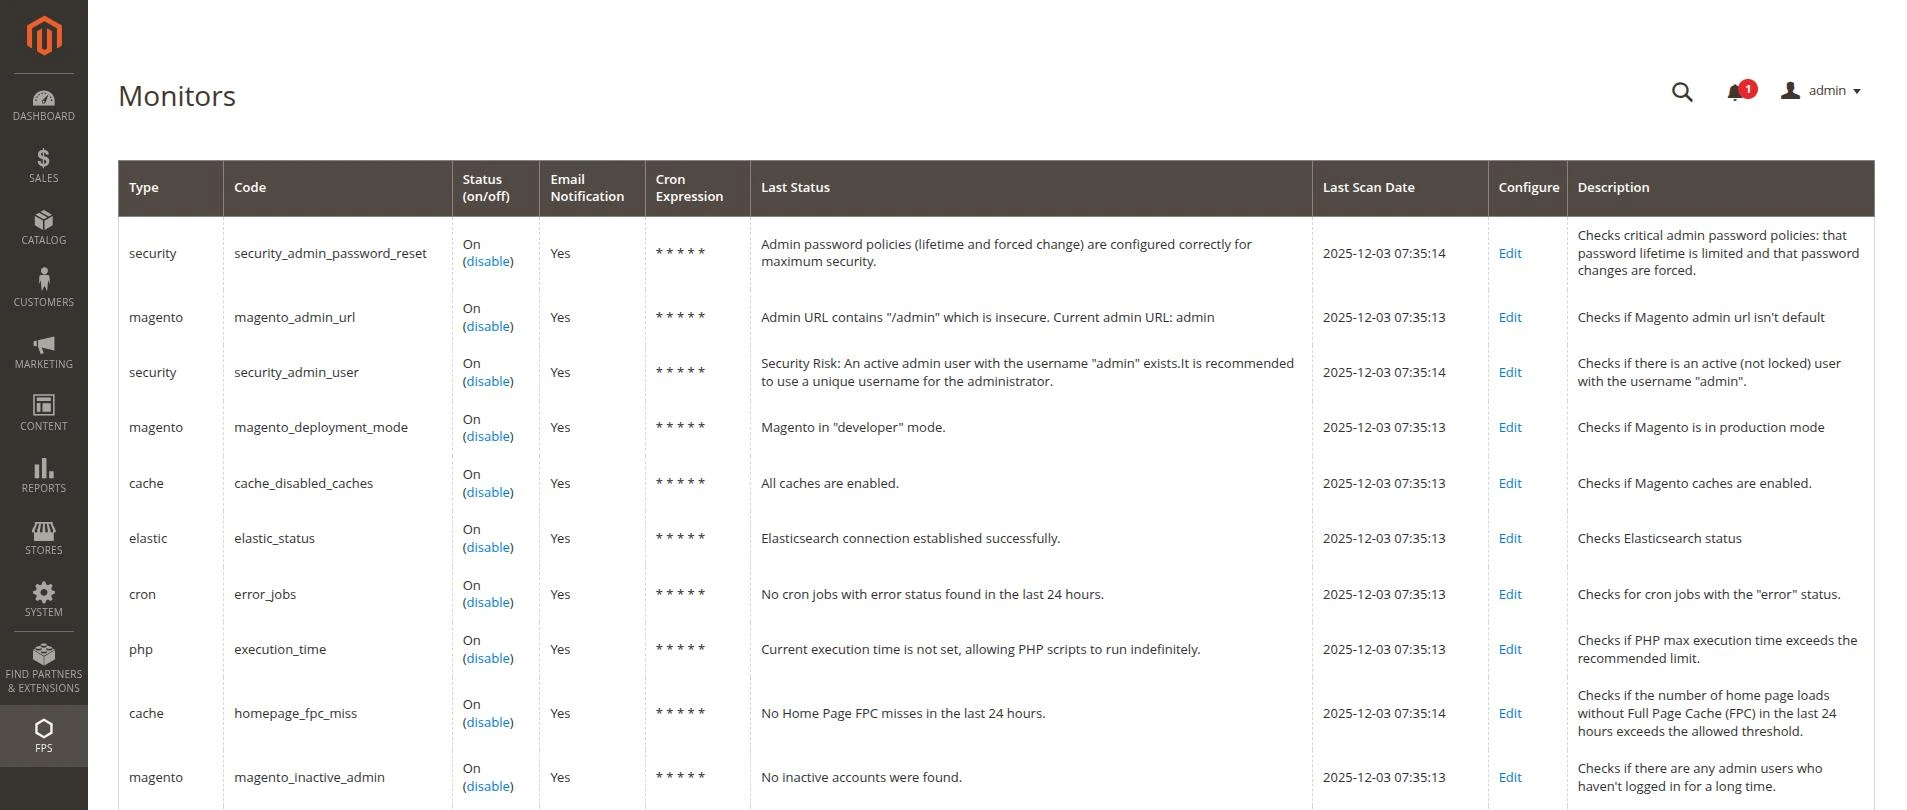
The module includes over 25 built-in monitors, here are many of them:
Magento Core
| Monitor | Description |
|---|---|
| Deployment Mode | Verifies the system is running in production mode |
| Indexer Status | Monitors indexer status |
| Reindex Mode | Checks reindexing mode |
| Inactive Admin Users | Detects inactive administrators |
| Admin URL | Validates admin panel URL |
| Static Content Signing | Checks static content signing |
| Orders Count | Monitors order count |
| Search Terms | Tracks search queries |
| Sales Difference | Detects sales discrepancies |
| Shopping Cart Rules | Monitors cart rule count |
Caching
| Monitor | Description |
|---|---|
| Disabled Caches | Checks for disabled cache types |
| Invalidated Caches | Identifies invalidated caches |
| Varnish Presence | Monitors Varnish availability |
| Homepage FPC Miss | Analyzes Full Page Cache operation |
| Search Query Cache | Monitors search query cache |
Cron Jobs
| Monitor | Description |
|---|---|
| Long Duration Jobs | Identifies slow cron jobs with statistics |
| Missed Jobs | Detects missed cron jobs |
| Error Jobs | Tracks execution errors |
File System
| Monitor | Description |
|---|---|
| Logs Size | Monitors log file sizes |
| Logs Retention | Manages log retention |
| Media Size | Monitors media folder size |
Database
| Monitor | Description |
|---|---|
| Large Tables | Identifies large database tables |
| MySQL Optimizer | Checks optimizer configuration |
PHP
| Monitor | Description |
|---|---|
| Memory Limit | Monitors memory limit |
| Execution Time | Checks execution timeout |
| XDebug Status | Detects enabled XDebug |
Redis
| Monitor | Description |
|---|---|
| Session Storage | Checks Redis usage for sessions |
| Disable Locking | Monitors lock disabling |
| Evicted Keys | Monitors key eviction |
Elasticsearch
| Monitor | Description |
|---|---|
| ES Connection | Checks search engine connection |
Security
| Monitor | Description |
|---|---|
| Admin User | Checks for "admin" account |
| Password Reset | Monitors password reset tools |
Flexible Monitor Configuration
Each monitor can be configured individually:
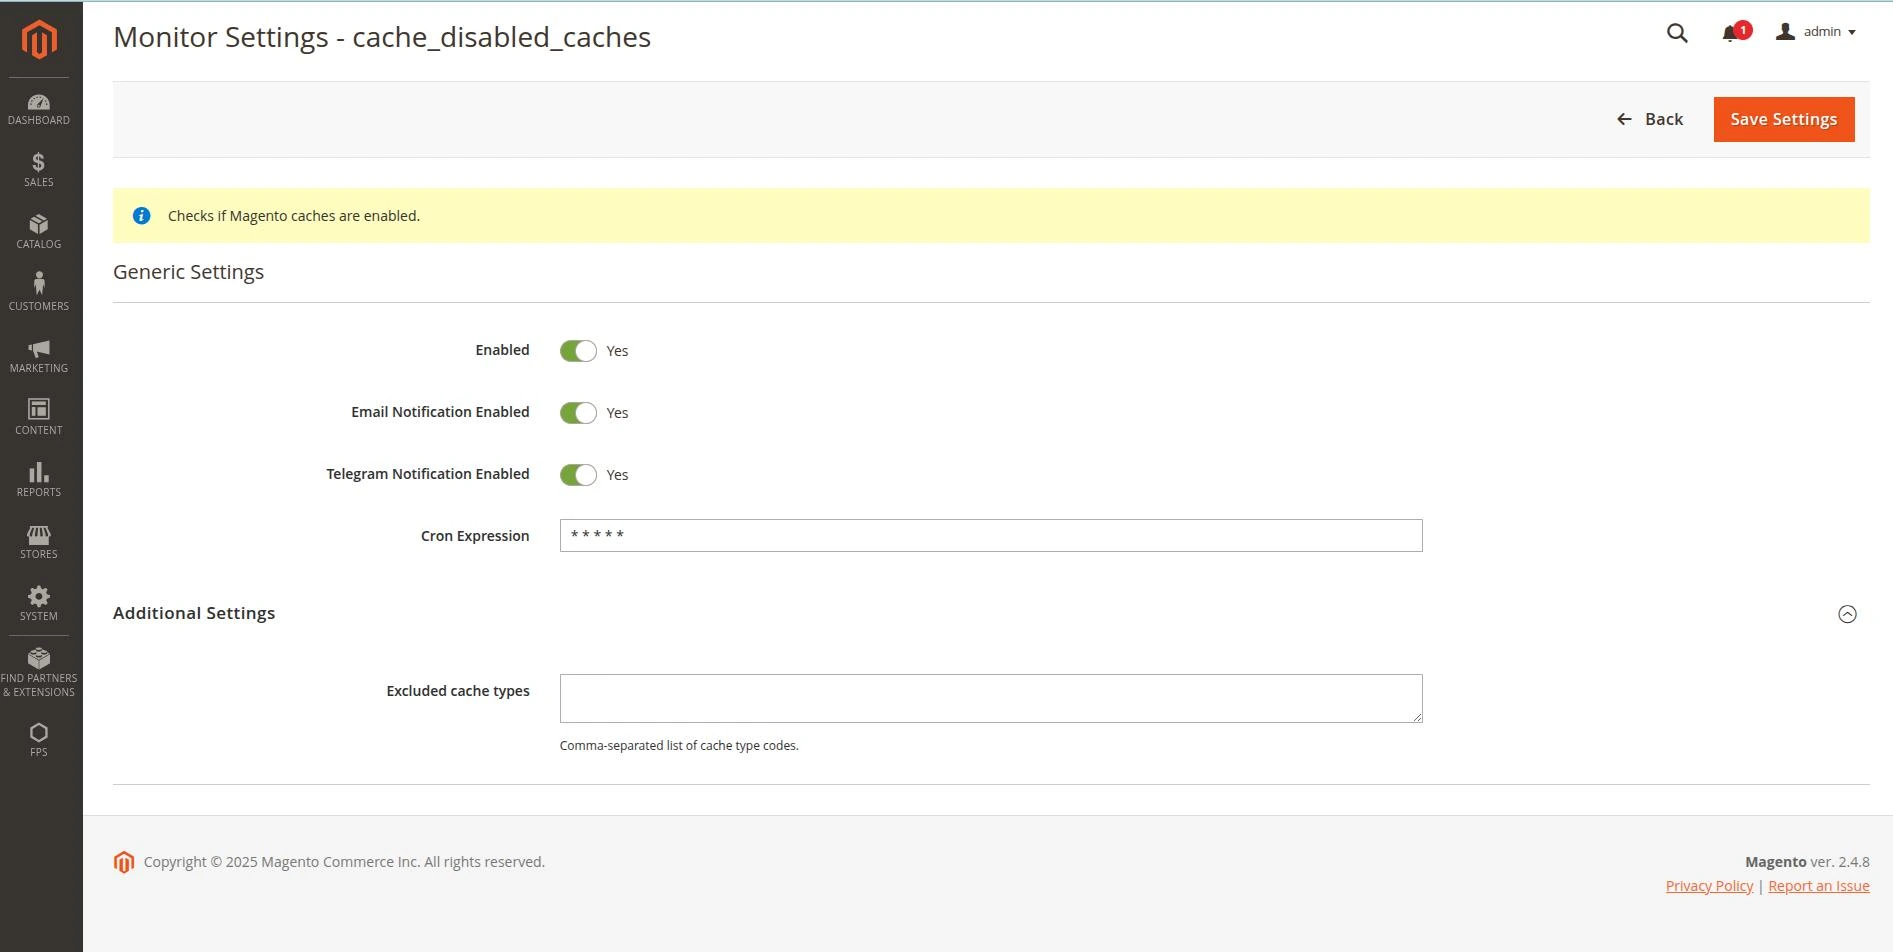
- Enable/Disable — unnecessary monitors can be disabled
- Run Schedule — flexible cron expressions for each monitor
- Threshold Values — configurable trigger limits
- Exclusions — ability to exclude specific items from checks
- Notifications — separate management of Email and Telegram alerts
Configuration examples:
- Large Tables Monitor — trigger threshold in GB, list of excluded tables
- Logs Size Monitor — maximum log file size, excluded files
- Long Duration Jobs — minimum execution time for alert
- Memory Limit Monitor — acceptable PHP memory limit
Notification System
When a problem is detected, the module instantly sends notifications:
Email Notifications
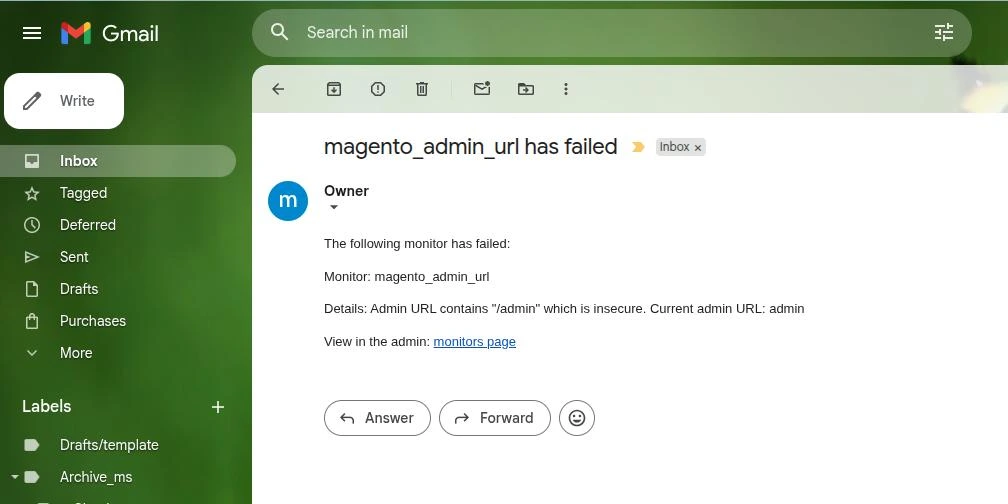
- Support for multiple recipient addresses
- Detailed problem description
- Direct link to the monitors page in admin panel
Telegram Notifications
- Integration with Telegram bot
- Instant push notifications
- Brief description with link to admin panel
For each monitor, you can separately enable or disable each notification channel.
Detailed Statistics
Some monitors collect detailed statistics between checks:
Long Duration Jobs shows:
- Cron job code
- Number of slow executions
- Average execution time
- Maximum execution time
- Last run date
Missed Jobs shows:
- Cron job code
- Cron group
- Number of misses for the period
Why This Matters
Automatic monitoring allows you to:
- Reduce downtime — problems are detected before they affect users
- Save time — no need to manually check dozens of parameters
- Increase reliability — critical problems won't go unnoticed
- Improve security — configuration vulnerabilities are detected automatically
- Optimize resources — overloaded components are detected in advance
Fact: Based on our experience, timely detection and resolution of issues with server environment, logs, cron jobs, indexers, and other problems tracked by the module helps prevent up to 50% of incidents affecting store operation.
Real-World Operation
The module works fully automatically after initial setup. Monitors run according to their schedules, and when a problem is detected, notifications are sent instantly.